
Module providing Consciousness Exploration Tools for PyTorch.
Note
This page is a reference documentation. It only explains the function signature, and not how to use it. Please refer to the gallery for the big picture.
-
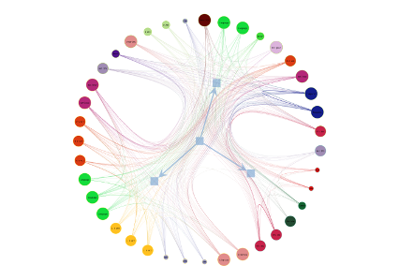
consciousnet.plotting.plot_graph(adj, names, hemi_groups, outdir)[source]¶ Display a graph plot using singularity and graph-tools.
- Parameters
adj : array (N, N)
the adjacency matrix.
names : list of str (N, )
the node names.
hemi_groups : list of int (N, )
the hemisphere tag labels.
outdir : str
the destination folder.
- Returns
graph_file : str
the generated chart.
Follow us